Dashboard
The Dashboard is where you see volume and value across your business: how many quotes people are starting, how many turn into leads, and how many proposals get accepted. This page defines each headline number, because several of them count something slightly different from what the label suggests.
Find it as Dashboard, the first item in the sidebar. The screen itself is headed Usage Dashboard.
Before you trust a number
Three things change how you should read everything below.
The figures are rebuilt once a day, not live. The update runs in the early hours, just after 01:30 UTC, and covers whole days up to and including yesterday. Nothing you or your customers did today appears until tomorrow morning. If you are checking whether a quote you just created landed, use the quote list, not the Dashboard.
The figures cover your whole business. If your account restricts you to your own quotes, the quote lists respect that but the Dashboard does not. The numbers here are everyone's.
Days run to UTC. During British Summer Time, anything created between midnight and 1am counts towards the previous day.
If you cannot see Dashboard in the sidebar at all, your account does not have the Analytics & Reporting permission. Ask whoever manages your account.
Set the period
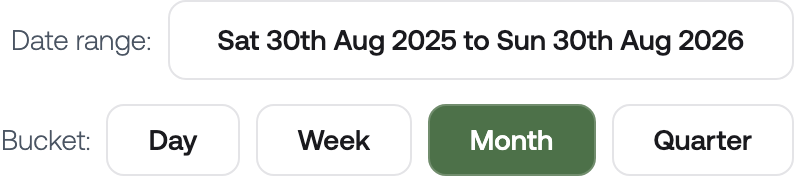
Two controls at the top right decide what every number covers.
Date range opens Select date range. It defaults to the last 12 months ending today. Pick dates on the calendar, or use one of the Preset ranges: From start of last year, From start of this year, From start of last month, From start of this month, From start of last quarter, or From start of this quarter. Future dates cannot be selected. Click Ok to apply.
Bucket sets how finely the charts are divided: Day, Week, Month, or Quarter. It defaults to Month. Weeks start on Monday. The bucket changes the shape of the charts only — it does not change any total.
The tabs
Six tabs run across the top. The first three are all instant quotes, split by who created them; the last three cover proposals, service plans, and your customer portal. Each is described below.

Read a card
Every metric appears in up to four places, and the suffix on the title tells you which you are looking at.
| Title ends with | What it shows |
|---|---|
| (for selected period) | One number: the total for your chosen date range. |
| (all time) | Three things: the running total at the end of your range in large type, the running total at the start of it underneath, and a pill showing the change between them. The date range moves these two points; it does not limit them. |
| (current period) | A chart of the metric per bucket across your range. |
| (cumulative all time) | A chart of the running total, across your range. |
So Started (for selected period) and Started (all time) are the same metric measured two ways, not two different metrics.
Instant quotes
Instant quotes (installer + customer) covers both channels, Instant quotes (installer-created) only quotes your team built, and Instant quotes (customer-created) only quotes your customers built themselves in your quote tools.
Underneath, a second row of tabs filters by product: All, Solar, Commercial solar, Battery, Heat pump, Air con, and Boiler.
All six product tabs appear whether or not you offer that product, so expect some of them to read zero. Quotes from the legacy solar quote tool are counted nowhere on this screen, as the note on the page says.
What each number counts
| Card | What it counts |
|---|---|
| Started | Quotes created in the period that got as far as having an address. Someone who opened a quote tool and left before entering a postcode is not counted. |
| Converted to lead | Quotes that have a contact attached — your customer entered their details, or someone on your team set a recipient. |
| Conversion percentage | Converted to lead divided by Started, calculated across the whole range in one go rather than averaged across the buckets. |
| Total quote value (£) | The prices of every quote created in the period added together. |
| Converted to lead value (£) | The prices of the quotes counted in Converted to lead added together. |
Total quote value and Started are not counted over quite the same set. Started needs an address; Total quote value adds up every quote created. In practice a quote only gets a price once someone has chosen a package, which comes after the address, so the two sets are near enough identical and dividing one by the other gives a fair average quote value.
Converted to lead, Conversion percentage, and Converted to lead value appear only on the Instant quotes (customer-created) tab. That is deliberate: a quote your own team created for someone already has their details, so the conversion would always read 100%.
Manufacturer charts
At the bottom of Instant quotes (installer + customer) sits Manufacturer related data (via chosen package): a breakdown of which manufacturers appear in the packages your customers picked, split into panels, inverters, batteries, heat pumps, cylinders, and air conditioning units. It counts quotes over your selected range, and only those where a package was chosen. A chart with nothing to show is hidden rather than shown empty.
Proposals
| Card | What it counts |
|---|---|
| Published | Proposals published during the period, counted on the day they were published. |
| Accepted | Proposals accepted during the period, counted on the day they were accepted. |
| Conversion percentage | Accepted divided by Published across the range. |
| Accepted proposal value (£) | The value of the proposals counted in Accepted. |
| Total proposal value (£) | The value of proposals created during the period. |
Two traps here. Published and Accepted count different events, so a proposal published in March and accepted in April lands in a different month for each — over a short range the conversion percentage can exceed 100% or read very low without anything being wrong. And Total proposal value is measured on the date a proposal was created, unlike the two cards above it.
Proposal values use the VAT-inclusive price where the proposal has one.
The other tabs
Service Plan Agreements counts agreements on the day their payment completed, alongside the annual and monthly recurring revenue they represent. Agreements that were created but never paid for are not shown.
Customer portal counts documents added to your customers' portals, split between uploaded files and pages written in the portal.
Related
- Find and follow up on instant quotes — the live list, where today's activity does show
- Working proposals — publishing and acceptance, which drive the proposal numbers